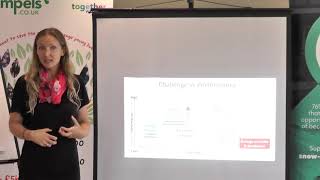
How To Use Gompels Environmental Dashboard
We’re going to be going through some of the tools available on our Environmental dashboard.
The environmental dashboard is a powerful tool made by our environmental researcher and allows you to calculate measure and assess your environmental impacts, and discover ways to reduce it. The Dashboard is part of our Pledge to all reduce our impact on the environment.
At the top of the page is a graph showing your annual emission for this year and last year. This currently shows the spending of a new business, as you may be, and only shows data from the summer of this year however as time passes the graph will continue to grow and show comparison data for the last two years.
On the right hand side there is a breakout of your emissions by material type, so you can assess which products will allow you reduce your emissions levels and a graph so you can track you can track the recycled content of all your products purchased over the last two years.
Below this top section is a breakdown of the emissions rates at each of your sites. Here there is an integrated traffic light system which visibly shows the current emissions levels of each site and where each area is against it’s target The traffic lights are green if they’re currently okay, amber if you are getting close to your target and red if you have exceeded your emissions targets.
When you click on each individual site you can manually set the targets.
for the location, and you can see immediately how this changes the traffic lights.
When you click the group settings button next to the site summary you can fine tune the analytics on the dashboard. Here you can change the start date of the financial year. You can group the sites based on place, number of beds or number of residents. You can change the target periods to match your calendar. And change what data is displayed on the graphs.
This tool allows you to keep in control and alert of your environmental impacts, and find ways to reduce it, our key accounts team can tailor your visibility on the dashboard depending on how much access you wish to grant each member of your team, and are always available to talk you through our range of tools, and to discuss ways to reduce your environmental impact.